Simple computations
The library can be used to compute delay and buffer bounds for any kind of curves.
var sc = new RateLatencyServiceCurve(3, 3);
var ac = new SigmaRhoArrivalCurve(4, 1);
var delay = Curve.HorizontalDeviation(ac, sc);
// Output: 13/3
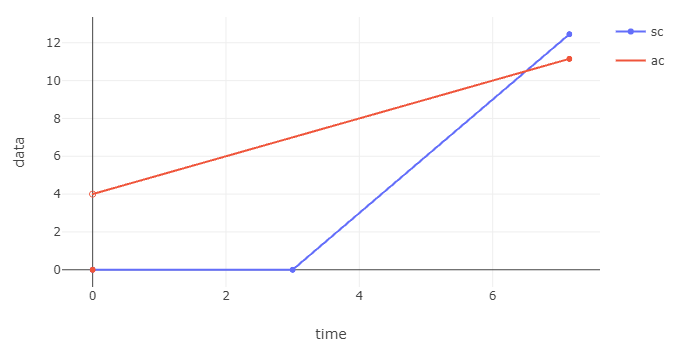
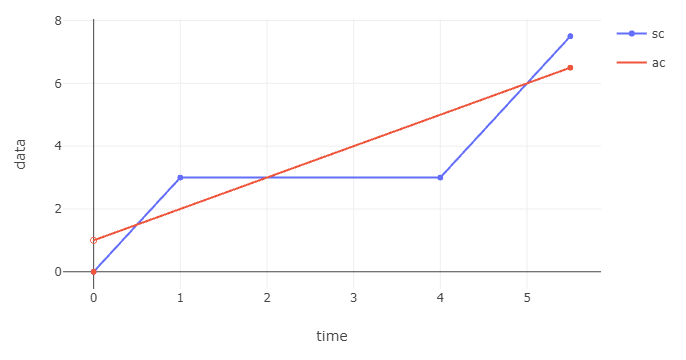
y = 4.The calculation works also for general curves, for example (from [DNC18, p. 121]):
var sc = Curve.Minimum(
    new RateLatencyServiceCurve(0, 3),
    new RateLatencyServiceCurve(4, 3) + 3
);
var ac = new SigmaRhoArrivalCurve(1, 1);
var delay = Curve.HorizontalDeviation(ac, sc);
// Output: 2/1
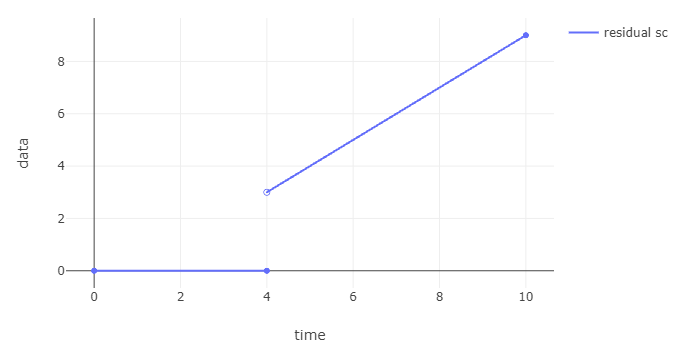
y = 3.The operators can be used to naturally construct any min-plus expressions. For example, computing a residual service curve in a FIFO server [DNC18, p. 166]:
var beta = new RateLatencyServiceCurve(2, 3);
var alpha = new SigmaRhoArrivalCurve(3, 2);
var theta = 4;
var delta_theta = new DelayServiceCurve(theta);

var alpha_theta = Curve.Convolution(alpha, delta_theta);
var diff = Curve.Subtraction(beta, alpha_theta, nonNegative: true);
var residual = Curve.Minimum(diff, delta_theta);
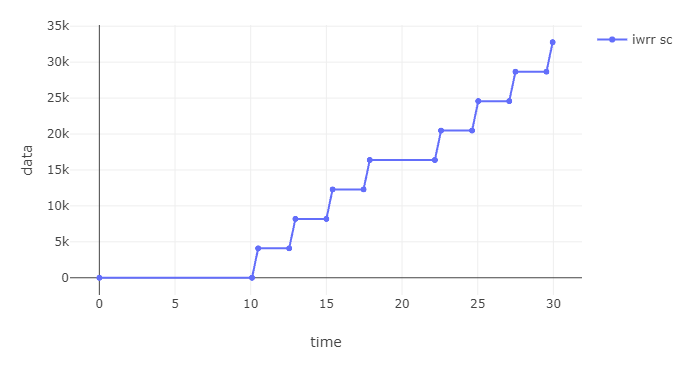
As another example, computing the strict service curve for Interleaved Weighted Round-Robin (IWRR) described in [TLBB21] (using Th. 1 with the parameters in Fig. 3):
var weights = new []{4, 6, 7, 10};
var l_min = new []{4096, 3072, 4608, 3072};
var l_max = new []{8704, 5632, 6656, 8192};
var beta = new RateLatencyServiceCurve(
    delay: 0,
    rate: 10000 // 10 Mb/s, but using ms as time unit
);
var unit_rate = new RateLatencyServiceCurve(0, 1);

// parameters computation omitted for brevity
int Phi_i_j(int i, int j, int x) { ... }
int Psi_i(int i, int x) { ... }
int L_tot(int i) { ... }

int i = 0; // the flow of interest
var stairs = new List<Curve>();
for(int k = 0; k < weights[i]; k++)
{
    var stair = new StairCurve(l_min[i], L_tot(i));
    var delayed_stair = stair.DelayBy(Psi_i(i, k * l_min[i]));
    stairs.Add(delayed_stair);
}
var U_i = Curve.Addition(stairs); // summation of min-plus curves
var gamma_i = Curve.Convolution(unit_rate, U_i);
var beta_i = Curve.Composition(gamma_i, beta);