Using notebooks
Over time, Polyglot notebooks have gradually become less reliable, with odd first-run errors and measurable loss of performance compared to compiled C# projects. Then in early 2026, Microsoft announced that Polyglot notebooks have been discontinued.
Being open source, there is some movement to preserve and continue development of this platform; but until that alternative matures the .NET Interactive notebook workflow described here is no longer the recommended long-term authoring path.
For a more stable alternative, see Using file-based C# apps.
A .NET notebook is a .dib file that contains snippets of code, called cells, which you can individually run to immediately see their outputs.
They are useful to show and discuss code step by step, as we do in our examples, but also to be modified and try things out.
Running a cell in VS Code.
The plotting functionality in .NET notebooks is provided with the Nancy.Interactive package. This is how you import it into a notebook:
#r "nuget: Unipi.Nancy.Interactive"

using Unipi.Nancy.Interactive;
How to plot
The main way to plot your curves is the Plots.Plot() methods,
which has various overloads to make it easier and immediate to use.
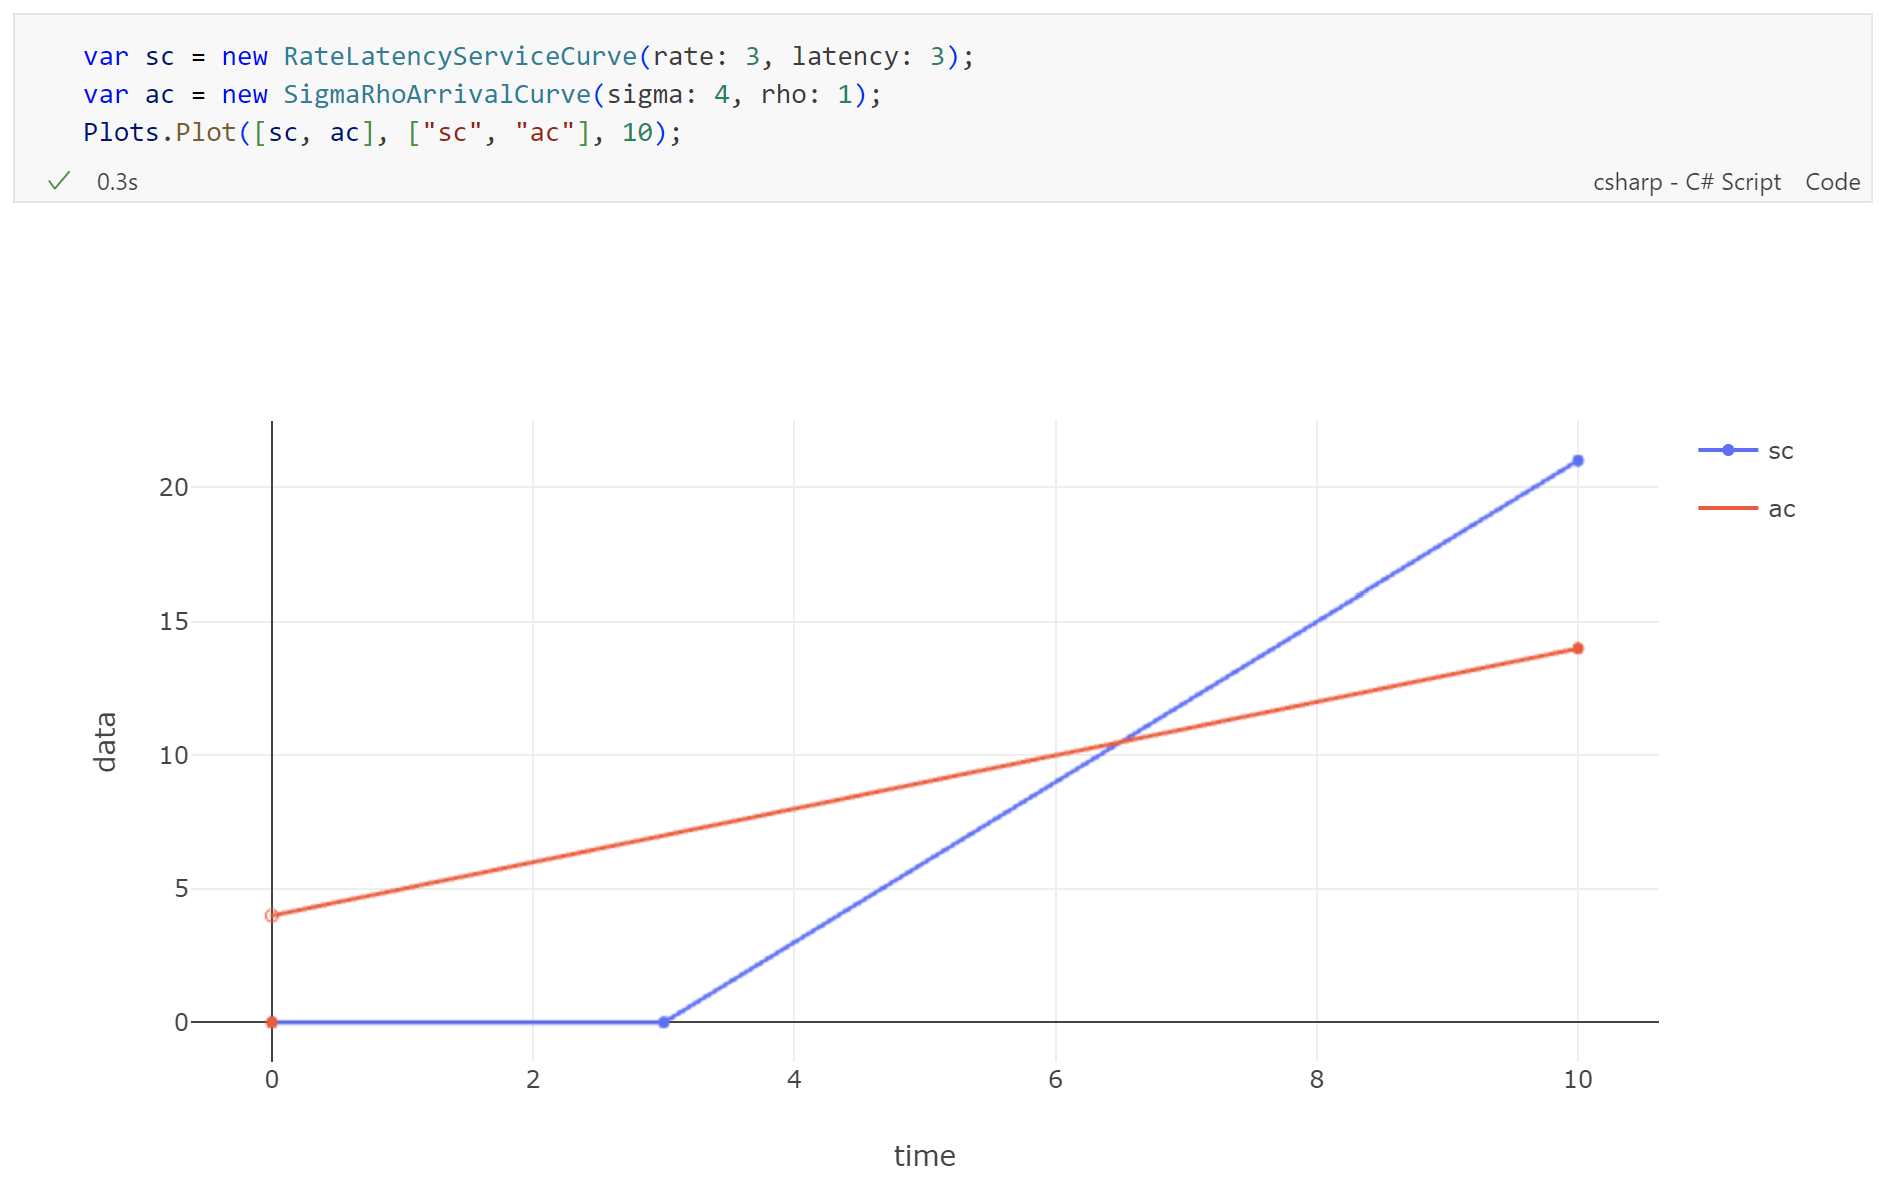
Plots.Plot() generates the image below the notebook cell.Plots.Plot() is designed and tested only for simple visualizations in notebooks. For other contexts and uses you may need something different.
Plots.GetPlot() and Plots.GetPlotHtml() return objects than can be used to render the plot elsewhere, e.g. in a browser page.
For TikZ plots, see ToTikzPlot().
You can use Plots.Plot() to visualize one or more Curve or Sequence objects. Many overloads are available:
Plots.Plot(curve, name, limit): plots the given curve from0tolimit, usingnamefor the legend.Plots.Plot(curves, names, limit): plots the given list of curves from0tolimit, using the correspondingnamesfor the legend.Plots.Plot(sequence, name, limit): plots the given sequence, usingnamefor the legend.Plots.Plot(sequences, names, limit): plots the given list of sequences, using the correspondingnamesfor the legend.
Names can be omitted.
For the overloads for single curve or sequence will, the default name will capture the name of the variable passed as argument, e.g. Plots.Plot(beta) will show "beta" in the legend.
For the overloads for multiple curves or sequences, names f, g, h, and so on, will be used instead.
For Curves, you can omit the time limit, in which case the function will compute a default one.
With the overloads described above, you can either explicitly declare the lists or arrays (both are fine), e.g.
var sc = new Curve( ... );
var ac = new Curve( ... );
Plots.Plot(
    new Curve[]{sc, ac},
    new string[]{"sc", "ac"}, // string[]
);
or use collection expressions, e.g.
Plots.Plot([sc, ac],["sc", "ac"]);
However, if none of the optional arguments is provided, you can use an even simpler syntax
Plots.Plot(sc, ac); // they will be called "f" and "g" in the legend