Study of an IWRR tandem
Using the IWRR model in the previous page, we can exemplify a study where non-convex service curves arise, hence a case where the flexibility of Nancy is useful.
Consider a flow traversing a tandem network of 2 server nodes. Access to each node is independently regulated using IWRR scheduling (with a different set of cross flows).
We consider the flow to be shaped by a token-bucket arrival curve. At each node, the flow is given an allocation matching said rate. For the DNC analysis, we use again the IWRR model described in [TLBB21].
First we (trivially) generalize the IWRR service curve computation as IwrrServiceCurve().
Curve IwrrServiceCurve(int foi, int[] weights, int[] l_min, int[] l_max, SuperAdditiveCurve beta)
{
    var unit_rate = new RateLatencyServiceCurve(1, 0);

    // parameters computation omitted for brevity
    int Phi_i_j(int i, int j, int x) { ... }
    int Psi_i(int i, int x) { ... }
    int L_tot(int i) { ... }

    var stairs = new List<Curve>();
    for(int k = 0; k < weights[foi]; k++)
    {
        var stair = new StairCurve(l_min[foi], L_tot(foi));
        var delayed_stair = stair.DelayBy(Psi_i(foi, k * l_min[foi]));
        stairs.Add( delayed_stair );
    }
    var U_i = Curve.Addition(stairs); // summation of min-plus curves
    var gamma_i = Curve.Convolution(unit_rate, U_i);
    var beta_i = Curve.Composition(gamma_i, beta);
    return beta_i;
}
Then, we define the parameters of our network
// ms as time unit, bit as data unit
// the flow has a max arrival rate of 10 Mbps, and is guaranteed such bandwidth at each node
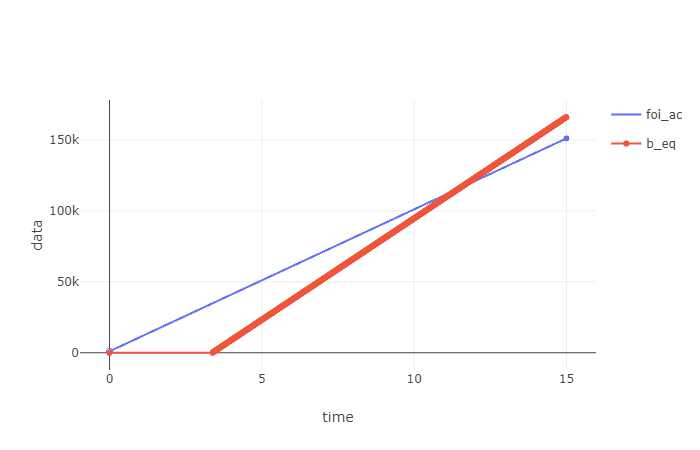
var foi_ac = new SigmaRhoArrivalCurve(1024, 10000);
// 100 Mb/s, 1 ms of latency
// 3 cross flows
var b1 = new RateLatencyServiceCurve(100000, 1);
var weights_1 = new []{10, 30, 40, 20};
var l_min_1 = new []{512, 512, 512, 512};
var l_max_1 = new []{1024, 1024, 1024, 1024};
// 200 Mb/s, 1 ms of latency
// 5 cross flows
var b2 = new RateLatencyServiceCurve(200000, 1);
var weights_2 = new []{10, 20, 40, 50, 30, 50};
var l_min_2 = new []{512, 512, 512, 512, 512, 512};
var l_max_2 = new []{1024, 1024, 1024, 1024, 1024, 1024};
We can now compute the IWRR service curve at each node.
var b_eq_1 = IwrrServiceCurve(0, weights_1, l_min_1, l_max_1, b1);
var b_eq_2 = IwrrServiceCurve(0, weights_2, l_min_2, l_max_2, b2);
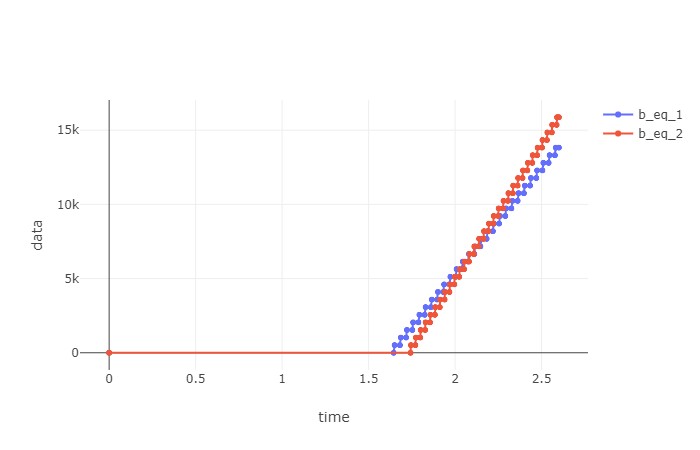
Note that the above are non-convex, and their period lengths are not integers. We complete the study by computing the equivalent service curve for the tandem using the min-plus convolution, and then computing the worst-case delay and backlog bounds as, respectively, the horizontal and the vertical deviation between the foi arrival curve and said service curve.
var b_eq = Curve.Convolution(b_eq_1, b_eq_2);
var delay_bound = Curve.HorizontalDeviation(foi_ac, b_eq);
// Output: 3,46 ms
var backlog_bound = Curve.VerticalDeviation(foi_ac, b_eq);
// Output: 34900 bit